You expressed offence at my username, Proper K. Hunt, but not at Heinrich Himmler. So names with Nazi connotations are OK? Ask yourself what sort of person would go onto a public forum with such a name. Yes, his/her private views are not my business, but when they are made public, a line of reasonable taste has been crossed. Or is use of fascist material acceptable on these forums?
Traders Joking
Frequently Asked Questions about the Signals service
Rule no. 14:
Provider is trading symbol called GOLD, and my broker has the same instrument, but it is called XAUUSD. Can I map symbols with different names by myself? In other words, is it possible to copy GOLD trades to XAUUSD?
No, you are not allowed to specify rules of mapping Provider's and Subscriber's symbols.
The client terminal automatically maps Forex trading symbols like EURUSD*. If Provider has symbol EURUSD! and Subscriber has symbol EURUSD (or vice versa), client terminal automatically detects similarity of such trading instruments and replaces their names when copying trading signals.
I don't know if someone already asked about this, but if so please give the link. Otherwise, I hope someone can help with this matter.
Symbol GOLD can't be mapped to XAUUSD, or vice versa, right?
I have EURUSD in my client terminal, so I can still receive signal provider which has EURUSD. (with dot), correct?
What about if I don't have one of provider symbol? For example, provider trade 10 symbols and I just have 9 similar symbols? Can I still receive signals and have trade?
No, it's not working.
EDIT : I have seen this problem with a signal, when the provider mades a trade on GOLD, the signal I was trying became disabled. I don't understand why the developpers can't address this as GOLD/XAUUSD is a very common symbol, but I guess they have theirs reasons. I filled a request to ServiceDesk and never got a reply.
Can't run unit tests
Hello,
I'm having trouble running my unit tests outside of the local environment. When I hit F5 on my UnitTestRunner.mq5, I get these results:
2013.09.04 13:21:36 UnitTestRunner (EURUSD,H1) [OK] All asserts passed.
2013.09.04 13:21:36 UnitTestRunner (EURUSD,H1) 32/32 asserts passed.
2013.09.04 13:21:36 UnitTestRunner (EURUSD,H1) Took 109 ms.
2013.09.04 13:21:36 UnitTestRunner (EURUSD,H1) MaximumFinderTest: Asserts: 1/1
2013.09.04 13:21:36 UnitTestRunner (EURUSD,H1) GeneticAlgorithmTest: Asserts: 0/0
2013.09.04 13:21:36 UnitTestRunner (EURUSD,H1) NeuralNetworkTest: Asserts: 12/12
2013.09.04 13:21:36 UnitTestRunner (EURUSD,H1) NeuronLayerTest: Asserts: 3/3
2013.09.04 13:21:36 UnitTestRunner (EURUSD,H1) SigmoidNeuronTest: Asserts: 1/1
2013.09.04 13:21:36 UnitTestRunner (EURUSD,H1) NeuronTest: Asserts: 2/2
2013.09.04 13:21:36 UnitTestRunner (EURUSD,H1) DefaultTest: Asserts: 13/13
However, when I run the same code inside of an Expert Advisor with the Strategy Tester, this is the result:
2013.09.04 13:23:26 Core 1 connection closed
2013.09.04 13:23:26 Core 1 log file "C:\Users\Daniel\AppData\Roaming\MetaQuotes\Tester\DAD3B8CC3EAC09C0C9725021DF0C7A65\Agent-127.0.0.1-3000\logs\20130904.log" written
2013.09.04 13:23:26 Core 1 tester stopped because OnInit failed
2013.09.04 13:23:26 Core 1 2013.07.01 00:00:00 OnDeinit
2013.09.04 13:23:26 Core 1 2013.07.01 00:00:00 Unit tests failed. Exiting ...
2013.09.04 13:23:26 Core 1 2013.07.01 00:00:00 [FAIL] Not all asserts passed.
2013.09.04 13:23:26 Core 1 2013.07.01 00:00:00 26/32 asserts passed.
2013.09.04 13:23:26 Core 1 2013.07.01 00:00:00 Took 0 ms.
2013.09.04 13:23:26 Core 1 2013.07.01 00:00:00 MaximumFinderTest: Asserts: 0/1
2013.09.04 13:23:26 Core 1 2013.07.01 00:00:00 MaximumFinderTest: assert: maximum finder didn't return expected results.
2013.09.04 13:23:26 Core 1 2013.07.01 00:00:00 GeneticAlgorithmTest: Asserts: 0/0
2013.09.04 13:23:26 Core 1 2013.07.01 00:00:00 NeuralNetworkTest: Asserts: 9/12
2013.09.04 13:23:26 Core 1 2013.07.01 00:00:00 NeuralNetworkTest: assertEqual: wrong outcome: -1.#INF0000 not equal to 2.00000000
2013.09.04 13:23:26 Core 1 2013.07.01 00:00:00 NeuralNetworkTest: assert: test failed.
2013.09.04 13:23:26 Core 1 2013.07.01 00:00:00 NeuralNetworkTest: assert: bias failed to put correctly
2013.09.04 13:23:26 Core 1 2013.07.01 00:00:00 NeuronLayerTest: Asserts: 3/3
2013.09.04 13:23:26 Core 1 2013.07.01 00:00:00 SigmoidNeuronTest: Asserts: 1/1
2013.09.04 13:23:26 Core 1 2013.07.01 00:00:00 NeuronTest: Asserts: 2/2
2013.09.04 13:23:26 Core 1 2013.07.01 00:00:00 DefaultTest: Asserts: 11/13
2013.09.04 13:23:26 Core 1 2013.07.01 00:00:00 DefaultTest: assertEqual: equality test failed: [17976931348623157000000000000000000000000000000000000000000000000000000000000000000000000000000000000000000000000000000000000000000000000000000000000000000000000000000000000000000000000000
2013.09.04 13:23:26 Core 1 2013.07.01 00:00:00 DefaultTest: assertEqual: equality test failed: 0 not equal to 549
2013.09.04 13:23:26 Core 1 2013.07.01 00:00:00 OnInit
2013.09.04 13:23:26 Core 1 Inp_Expert_Title=Stubborn
2013.09.04 13:23:26 Core 1 EURUSD,H1: testing of Experts\Test\Stubborn.ex5 from 2013.07.01 00:00 to 2013.08.01 00:00 started with inputs:
2013.09.04 13:23:26 Core 1 EURUSD,H1 (MetaQuotes-Demo): 1 minutes OHLC ticks generating
2013.09.04 13:23:26 Core 1 EURUSD,H1: history begins from 2012.01.02 00:00
2013.09.04 13:23:26 Core 1 EURUSD,H1: history cache reserved for estimated 9908 bars
2013.09.04 13:23:26 Core 1 EURUSD,H1: contains 9259 bars of beginning data from 2012.01.02 00:00 to 2013.06.28 23:00
2013.09.04 13:23:26 Core 1 EURUSD: history synchronized from 2012.01.02 to 2013.08.30
2013.09.04 13:23:26 Core 1 EURUSD: load 27 bytes of history data to synchronize
2013.09.04 13:23:26 Core 1 EURUSD: symbol synchronized, 3304 bytes of symbol info received
2013.09.04 13:23:26 Core 1 EURUSD: symbol to be synchronized
2013.09.04 13:23:26 Core 1 Intel Core2 Quad Q6600 @ 2.40GHz, 8191 MB
2013.09.04 13:23:26 Core 1 153 Kb of total initialization data received
2013.09.04 13:23:26 Core 1 successfully initialized
2013.09.04 13:23:26 Core 1 initial deposit 10000.00 USD, leverage 1:100
2013.09.04 13:23:26 Core 1 file added: Files\DTrader1_fittestGenome_weights.bin. 484 bytes loaded
2013.09.04 13:23:26 Core 1 file added: Files\DTrader1_fittestGenome_bias.bin. 81 bytes loaded
2013.09.04 13:23:26 Core 1 expert file added: Experts\Test\Stubborn.ex5. 142827 bytes loaded
2013.09.04 13:23:26 Core 1 940 bytes of symbols list loaded
2013.09.04 13:23:26 Core 1 708 bytes of input parameters loaded
2013.09.04 13:23:26 Core 1 1490 bytes of tester parameters loaded
2013.09.04 13:23:26 Tester quality of analyzed history is 100%
2013.09.04 13:23:25 Core 1 common synchronization completed
2013.09.04 13:23:25 Tester EURUSD,H1 (MetaQuotes-Demo): testing of Experts\Test\Stubborn.ex5 from 2013.07.01 00:00 to 2013.08.01 00:00
2013.09.04 13:23:25 Core 1 authorized (agent build 842)
2013.09.04 13:23:25 Core 1 connected
2013.09.04 13:23:24 Core 1 connecting to 127.0.0.1:3000
2013.09.04 13:23:24 Core 1 agent process started
The code has not changed a bit! Any thought on this one?
The New Look-and-Feel of Trading Signals
what is the exact formula of the rating?
This formula is not publicly available.
Expert Advisors: ElliottWaveMaker 3.0
This is very simplified description about : Elliott Wave
======
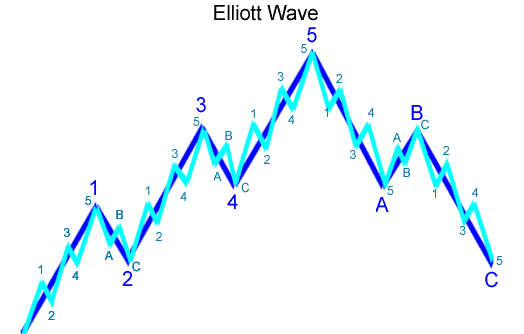
Elliott Wave theory states that prices move in waves. These waves occur in a repeating pattern of a (1) move up, (2) then a partial retracement down, (3) another move up, (4) a retracement, (5) then finally a last move up. Then, there is a (A) full retracement, followed by a (B) partial retracement upward, then (C) a full move downward. This repeats on a macro and micro time frame. A visual illustration of the basic pattern of the Elliott Wave is given below. A real life example of Elliott Wave in action is given further down:

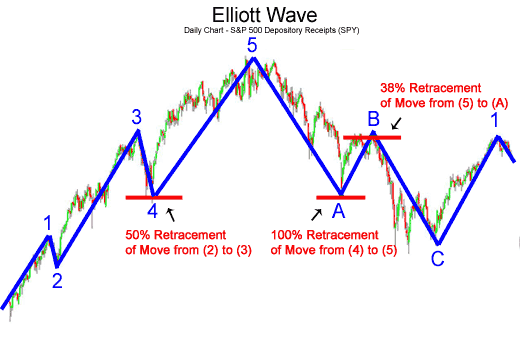
Elliott Wave is based on crowd psychology of booms and busts, rallies and retracements. Traders often use fibonacci numbers (see: Fibonacci) to anticipate where a retracement is likely to end and thus the place where they should place their trade. The chart below illustrates the Elliott Wave pattern applied to crowd psychology (i.e. S&P 500) and Fibonacci Retracements:

In the example above of the S&P 500 ETF, if the Elliott Wave theorist recognizes that he/she just completed a the leg from (2) to (3) and the market is beginning to retrace, the trader might put a buy order at the 38% Fibonacci retracement. In the example above, that trade would have failed and the trader would have been stopped out of their long position. The trader then might consider putting an order in at the 50% retracement. In the example above, that would have been an extremely profitable trade, making up for the previous loss and more.
Next, realizing that the latest trend was the (4) to (5) upmove, the Elliot Wave theorist would next expect a downward move to (A). This retracement is larger than the previous (1) to (2) retracement and (3) to (4) retracement. A reasonable guess as to where the retracement (5) to (A) will end is the 0.618, the golden fibonacci ratio.
Selecting the 61% retracement would have proved profitable for a little while, assuming the trader didn't have extremely tight stop losses in place, but the retracement turned out to be a head fake. Subsequently, the next often used Fibonacci retracement is 100%. This trade would have been very profitable, given the S&P 500 retraced almost perfectly at 100% of the move from (4) to (5).
A likely profit target to exit at least part of the trade initiated at point (A) is the 38% Fibonacci level. This also happened to be the turning point for the next leg down from (B) to (C).
Indicators: Swing Index
The Swing Index is a technical indicator that predicts future short-term price action:
- When the Swing Index crosses over zero, then a short-term price movement upward is expected.
- When the Swing Index crosses below zero, then a short-term price movement downward is expected.
A few of the many buy and sell signals are shown below in the chart of the E-mini Russell 2000 Futures contract:

As can be noted from the chart above of the e-mini futures contract, numerous
buy and sell signals are given. The Swing Index was made for very short-term
trading.
The Swing Index is best used in its later format, the Accumulative Swing Index (see: Accumulative Swing index in MT5 CodeBase)
Indicators: Accumulation Swing Index (ASI)
Developed by Welles Wilder in his popular technical analysis book New Concepts in Technical Trading Systems, the Accumulative
Swing Index (ASI) is mainly used as a divergence and confirmation tool, but can
be used for buy and sell signals as well. It was designed to be used for futures
trading, but can be used for stock trading and currency trading too. Basically,
the Accumulative Swing Index is a running total of the Swing Index (see: Swing Index).
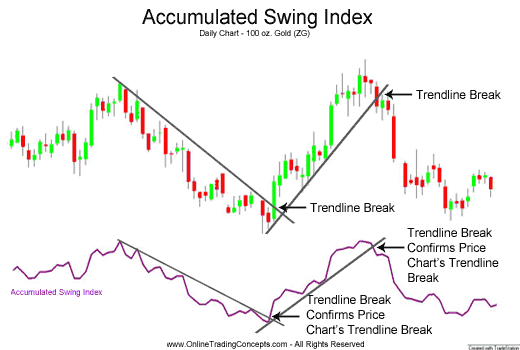
The chart below of gold futures shows the Accumulative Swing Index:

In the chart shown below, the Accumulative Swing Index confirmed Gold's downtrend. Subsequently, when Gold broke the downward trendline, the Accumulative Swing Index confirmed the trendline break as well.
Similarly, the upward move in the Gold futures contract was confirmed by the Accumulative Swing Index and the upward trendline break was confirmed too.
Buy Signal - Accumulative Swing IndexBuy when Accumulative Swing Index breaks above a downward trendline or, in a price consolidation period, above resistance.
Sell Signal - Accumulative Swing IndexSell when the Accumulative Swing Index breaks below an upward trendline or, in a price consolidation period, below support.
Do you think Smilies would be a helpful addition to this Forum ?
If you want to facilitate it, go right ahead. But remember, we reap what we sow.

I'm not interested in your soul . . . I would, however, like to know if you are being serious or exercising an overly dry sense of humour, I can't tell from what you have written, can you add a smiley, it would help me

How delete
your broker contact page
Why brokers contact page? Read this one :
How to Start with Metatrader 5
newdigital, 2013.04.04 08:17
Some members are asking some questions on the forum while those questions should be forwarded to Service Desk. So, please read this good thread about it Get in touch with developers using Service Desk!
After so many people asking, why is there still no way to amplify signal volume?
Do you think Smilies would be a helpful addition to this Forum ?
"I would, however, like to know if you are being serious or exercising an overly dry sense of humour, I can't tell from what you have written, can you add a smiley, it would help me"
If you can't tell then you are already dead inside.
Discussion of article "How to Create Your Own Trailing Stop"
Hi, I'm very new to the MQL5 community so please bear with me. How do I get this expert adviser to run in MT5? Is it possible or does it have copy rights?
Regards
Pine
Hello,
You can use it without problem. See the documentation to learn how to run an expert advisor.
How delete
What is problem? I will check this situation, certainly.
We have a lot a people who asked similar question on the forum: here, here, or here, here...
1. They act as provider by registering their account as a signal provider.
2. Then they change their mind and remove their signal as provider.
3. They decide to subscribe to a subscriber then, but with the same account they used as provider.
4. The system refuse with message : "Specified account already being used as a signal. Signals resale is prohibited."
Of course, I know an account can't be used simultaneously as provider and as subscriber. But here it seems this is not simultaneously.
So, each time, a user ask this question, I refer to ServiceDesk as I don't know what is possible or not.
Trading Signals Statistics Expanded
We have implemented a number of changes to Signals statistics to simplify evaluation of results. Now, you can quickly assess the trading activity of a selected signal, as the informative value of the charts has been considerably improved.
First, Growth and Balance charts now feature the vertical line dividing them in two parts - the time intervals before and after connecting the signal to the monitoring. Thus, it is possible to trace the point, at which the signal has been connected to the monitoring, and examine the differences in trading activity between these time intervals.

Second, blue and green parts of Growth and Balance charts are now interchanging at each non-trading operation (depositing or withdrawing the funds from the account). The more such interchanges you can see, the more non-trading operations have been detected on the account. View the signal's history to determine the type of each non-trading operation (depositing or withdrawal).

Third, Risks tab has been implemented. It consists of MFE (Maximum Favorable Excursion - maximum profit that could have been fixed before closing the trade) and MAE (Maximum Adverse Excursion - maximum loss detected during the trade) distribution dot diagrams. Each deal has its own potential profit (MFE) and potential loss (MAE) values displayed on the appropriate diagrams. Besides, these diagrams also display best and worst trades, maximum consecutive wins and losses, as well as maximal consecutive profit and loss.

Fourth, best and worst trading series can now also be seen on Growth and Balance charts. Just hover your mouse cursor over the necessary parameters in the table below.

With the extended statistics, traders can quickly see the results of signal's trading activity and assess their risks. This can be useful both for potential Subscribers and those who want to enable private monitoring of their accounts. Open the description of any signal on the website and try the extended statistics right now!
Press review
- past data is n/a
- forecast data is n/a
- actual data is n/a according to the latest press release
==========
Press conference following the meeting of the Governing Council of the European Central Bank on 5 September 2013 at its premises in Frankfurt am Main, Germany, starting at 2:30 p.m. CET:
- Introductory statement by Mario Draghi, President of the ECB.
- Question and answer session. Registered journalists pose questions to Mario Draghi, President of the ECB, and to Vítor Constâncio, Vice-President of the ECB.
Watch official video here.
Who's currently short on EURUSD
- I am
- I wish i were
- EURUSD bad pair i dont trade it
hello
I agree with you, though there are many applications and many formats to work with!. Anyway there is already many stuff covering this topic, for instance, A Library for Constructing a Chart via Google Chart API
Best regards
Bar chart next to signal provider name giving wrong info
EURUSD Technical Analysis 01.09 - 08.09 : Possible Correction Within Primary Bullish
Yes, it is still bullish as a primary market condition (because the price is above Ichimoku cloud), but correction as a secondary trend. I am talking about D1 timeframe. You can see it by yourself :
MetaTrader Trading Platform Screenshots
MetaQuotes Software Corp., MetaTrader 5, Demo
bullish as a primary

