Forum on trading, automated trading systems and testing trading strategies
Sergey Golubev, 2015.07.13 06:58
EUR/USD: Make Or Break; Levels & Targets - Citi (based on efxnews article)

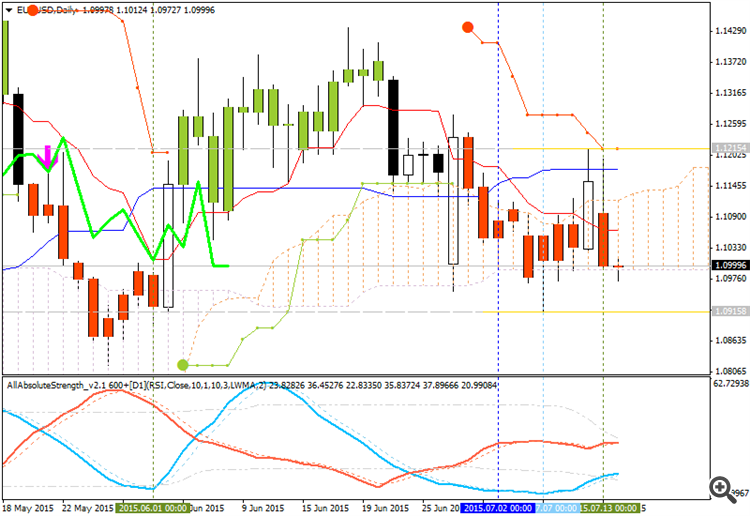
"The failure to set a new high on 18 June (1.1439 versus 1.1468 high on 15 May) raised the first question mark. Now, a close below 1.0819, if seen, would create a lower low and firmly suggest that the downtrend has resumed," Citi adds.
In that eventuality, Citi thinks that the present pattern could then be identified as either:
"1- A head and shoulders formation with a neckline at 1.1124 and a downside target of at least 1.0370 (new trend lows).
2- An effective double top with a neckline at 1.0819 and a minimum target of 1.0185-1.0200," Citi clarifies.
"While longer term (possibly summer 2016) we retain a target of .8800-.9000 we would envisage seeing the target rangers above in the weeks ahead if this break of 1.0819 takes place," Citi projects.