Quantcast
Channel: MQL5: MetaTrader 5 trading, automated systems and strategy testing forum
Viewing all 75046 articles
Browse latest View live

How to Start with Metatrader 5

$
0
0

Forum on trading, automated trading systems and testing trading strategies

Indicators: Point and Figure

Sergey Golubev, 2013.09.12 16:29

Point & Figure Charting

Point & Figure Charting reduces the importance of time on a chart and instead focuses on price movements. Point & Figure charts are made up of X's and O's, X's being new highs and O's being new lows. There are two inputs to a Point & Figure chart:

  1. Box Size: The size of movement required to add an "X" or an "O". For example, a stock at a price of $20 may have a box size of $1. This means that an increase from $20.01 to a high of $21.34 means another "X" is added. If the high price only increased to $20.99, then another "X" is not added because the stock didn't close another box size ($1) more.
  2. Reversal Amount: The size of reversal before another column is added to a Point & Figure chart. To illustrate, if the reversal amount is $3, then the $20 stock would have to fall down to $17 before a new column (in this example of O's) would be started.

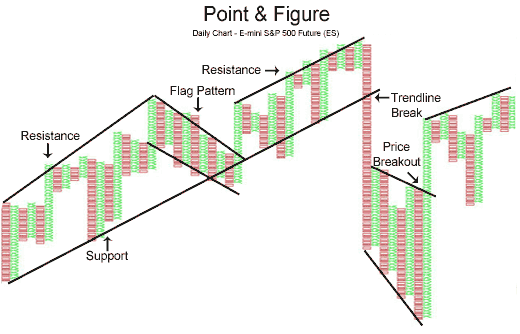
One of the main uses for Point & Figure charts, and the one emphasized in this section, is that Point & Figure charts make it easier for traders to see classic chart patterns. In the chart below of the E-mini S&P 500 Future, the Point & Figure chart emphasized support and resistance lines as well as areas of price breakouts:

Again, the Point & Figure chart makes it easy for traders to see the double bottom pattern below in the chart of the E-mini S&P 500 Futures contract:
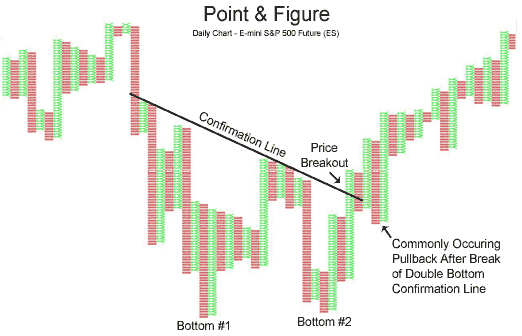

The e-mini chart above illustrates the two bottoms of the double bottom pattern, as well as the confirmation line that is pierced, resulting in a buying opportunity.

Point & Figure is a very unique way to plot market action. The strongsuit of Point & Figure charting is that it eliminates the element of time and focuses on what is truly important - price


Something Interesting to Read July 2015

$
0
0

Forum on trading, automated trading systems and testing trading strategies

Something Interesting to Read August 2014

Sergey Golubev, 2014.08.04 10:36

The Definitive Guide to Point and Figure: A Comprehensive Guide to the Theory and Practical Use of the Point and Figure Charting Method
by Jeremy du Plessis

Point and Figure charts are one of the great secrets of the Technical Analysis world.  Highly sophisticated and with a thoroughbred pedigree, they can, however, be overlooked by traders today.

Jeremy du Plessis - one of the foremost Point and Figure experts in the world - returns with a fully updated second edition of this definitive guide in an effort to redress this imbalance. This second edition, with an extensive revision to the text and introduction of brand new techniques, demystifies the world of Point and Figure charting. It includes a detailed explanation of the history and development of the technique from its invention to the modern day, and covers the makeup of the chart patterns, why they are created, and how to interpret them.

Throughout, readers are encouraged to understand Point and Figure charts from first principles, rather than just remember the names of a series of patterns. It is the first major work for 50 years to discuss in depth the original 1-box reversal method of Point and Figure charting and contrast it with the more popular 3-box reversal method.

Further, the explanation of how to use Point and Figure charts to project targets and calculate risk-reward ratios is the most comprehensive ever seen. Also featured in the second edition are:

  • A step-by-step analysis of the FTSE 100 Index using the 3-box method, as well as the NASDAQ Composite Index, using the 1-box method
  • A detailed discussion of optimising techniques
  • An in-depth chapter on Analysing Point and Figure charts, extensively rewritten from the first edition
  • A new explanation of how Point and Figure parameters are chosen and the implications of choosing them
  • Two new Point and Figure construction methods never seen before
  • Point and Figure's contribution to market breadth, with a look at bullish percent and two brand new indicators
  • Full discussion of Point and Figure gaps and how they provide valuable information about the chart
  • Lesser known, more advanced techniques such as the use of moving averages, parabolic SAR and Bollinger Bands on Point and Figure charts
  • Price and volume activity histograms and how they provide information about support and resistance

All this is illustrated with numerous colour charts and observations from years of trading experience. According to du Plessis, Point and Figure charts are the 'voice of the market'. This book helps you listen to, and understand, that voice. Part of the Market Technicians Association (MTA) Required Reading list.


programming question

$
0
0
double GetPriceVal(string symbol,ENUM_TIMEFRAMES timeframe, string s)
{
        double retval = -1; //signal failure
        string res[];
        string param;
        int index;
        int numstrings =  StringSplit(s,'[',res);
        if (numstrings==2)
        {
                param= res[0];
                numstrings =  StringSplit(res[1],']',res);
                if (numstrings==2)
                {
                        index = StrToInteger(res[0]);           
                        // Print (param," ",index);
                        if (StringCompare(param,"high",false)==0)
                        {
                                double doubleval[];
                                if (CopyHigh(symbol,timeframe,index,1,doubleval)==1)
                                        retval= doubleval[0];
                        }
                }
        }
        return(retval);
}

Something like this... (just a quick coding... ;)

call it, if positive result, its a real value

Print(GetPriceVal(Symbol(),0,"High[1]"));

problem at programing TP & SP

$
0
0
Something interesting happened while I try to solve the problem. When I set Stop Loss for long and short OrderSend function to Zero the EA freeze in the test at the same point, but when I set the Take Profit for long and short to Zero the EA completed the test without freezing.

Intervall of connection to signal server.

$
0
0

I am not aware of another way to synch, other than how you mentioned (restarting).  But I am also not currently subscribed to any signals, because I currently do not trade, and I also do not leave my laptop on all the time to be "open to trading".

Enumerated lists code chunks, by category (MQL4 and MQL5)

$
0
0
You name all your enums with a word "list", so you probably wanted to create lists rather than enums. I cannot figure out where your enums would be used.

I offer $100 to anyone who can program a hedge EA for me

$
0
0
JD4:
Funny enough, they actually have a section designed for just this type of thing, called the Freelance section.  You can post your request there and have people bid on it.
Ah...thanks mate! :-)

Press review

$
0
0

Quant Signals For EUR/USD, USD/JPY, & Other Majors - Barclays (based on efxnews article)

The latest signals from Barclays Capital 'FX Quantitative Analyzer' model:


Market Condition Evaluation based on standard indicators in Metatrader 5

Trailing Stop OrderModify error 1

Usage of Signal-Classes

$
0
0
Hello everyone,


I tried to setup an Expert-Advisor in mql5 trading with several Indicator-Signals using the Signal-Classes from StdLib.

I've searched a lot for examples, but can only find complete Trading-Systems with objects of "CExpert" (propably just made with a wizard).

But I cannot find any simple discriptions of the proper usage of those Signal-Classes.

For Example I want to use "CSignalMACD" from "Expert/Signal/SignalMACD.mqh":

I just want to create an Object like

CSignalMACD* sm = new CSignalMACD();

and use the calculated signals, be something like:

    if     (sm.LongCondition()) buy();
    else if(sm.ShortCondition()) sell();

I know that most time I have to call some kind of calculate-method. For indicator-classes like "CiBands" it is the method "Refresh()"

Could please anybody tell me what methods I actually have to call to receive the signals?


For the Bollinger-Indicator it is easy:


#include <Indicators/Trend.mqh>
CiBands bo;

...

  bo.Create(_Symbol, PERIOD_CURRENT, 500, 0, 1.5, PRICE_CLOSE);

...

  bo.Refresh();

  upp = bo.Upper(0);

  base = bo.Base(0);

  low = bo.Lower(0);

...

This all works without Problems. I found out, that the methods "Create(...)" and "Refresh()" are essencial.

But how can I use the Signal-Classes like "CSignalRSI" in this way? Which methods do I need?

Automatic Limit on Order Volume?

$
0
0
Marco vd Heijden:

you can write one it is not so hard.

You are right ;)

Experts: FMOneEA

$
0
0
I am running FMOneEA on EurUsd and UsdCad H4 and can see in the expert's log
the ZigZag-indicator is constantly loaded and removed and loaded and removed and ...
Can anybody confirm this? Rather strange! Gooly

FX5_Divergence_V1_1 Need sound alert on that signal indicator help anyone ?

$
0
0

Hi this indicator gives signals but no alert, can anyone make it to have sound alert ? Thank you in advance

(version 2 of this indicator has sound alert but the signal is delayed with 1 candle ) 

Experts: FMOneEA

$
0
0
"I can't reproduce this issue."
=> Can it be that my terminal has a "Working Set (Memory): 706.480 K (directly taken from the task manager).

=> My logfile of today has the size of 390 KB with nothing but (MEZ):
0 21:45:10.396 ZigZag EURUSD,H4: uninit reason 1
0 21:45:10.396 Custom indicator ZigZag EURUSD,H4: removed
0 21:45:11.260 Custom indicator ZigZag EURUSD,H4: loaded successfully
0 21:45:11.264 ZigZag EURUSD,H4: initialized
0 21:48:54.694 ZigZag EURUSD,H4: uninit reason 1
0 21:48:54.694 Custom indicator ZigZag EURUSD,H4: removed
0 21:48:54.754 Custom indicator ZigZag EURUSD,H4: loaded successfully
0 21:48:54.758 ZigZag EURUSD,H4: initialized

=> I saved the ZigZag.mq4 under ZigZag_2.mq4 and applied it with its default variables to the chart, this indicator is running without any problem.

=> So I think it's not a problem of the ZigZag-indicator, nor 3rjfx' code - but it must be a feature of the terminal we do not know as there is no mq4-function that deletes a an indicator from the chart - only ExpertRemove(), but this would cause a 0 in the log-file.

=> I heard several times that an indicator once called CANNOT be 'removed from the chart' or from the terminal's memory as I once tried a recursive call of an indicator and crashes the terminal.

Is there a way to start terminal in a verbose mode?

Value of Signal on the MACD

$
0
0

Hello, everybody!

 Could You tell me, how can I receive the value of the signal on the MACD Indicator?


Thanks in advance!

 Bye! 

EA AND MANUAL 2015

ANALYTICS OF GU DAILY TREND

$
0
0
Marco vd Heijden:

Its still going very strong today.


amazing indikator 

how much profit you gain from signal subscription from subscriber . . . . .

Metatrader 4 Signal Lot Size not copied?

$
0
0
amegahed:
I'm subscribing to a signal that has leverage of 1:500.  I use OANDA which stops at 1:50.  Does this mean the lot size will always be 10 times less than the signal? I hope I understand this correctly.  Is there a way to match it?
Leverage isn't the only deciding factor but it does make one of the biggest differences. Read the article linked in the post above yours, that will give you all the answers.
Viewing all 75046 articles
Browse latest View live